Dashboard & Analytics
The RefundShield dashboard gives you an overview of your refund protection performance across all your apps.
Dashboard Overview
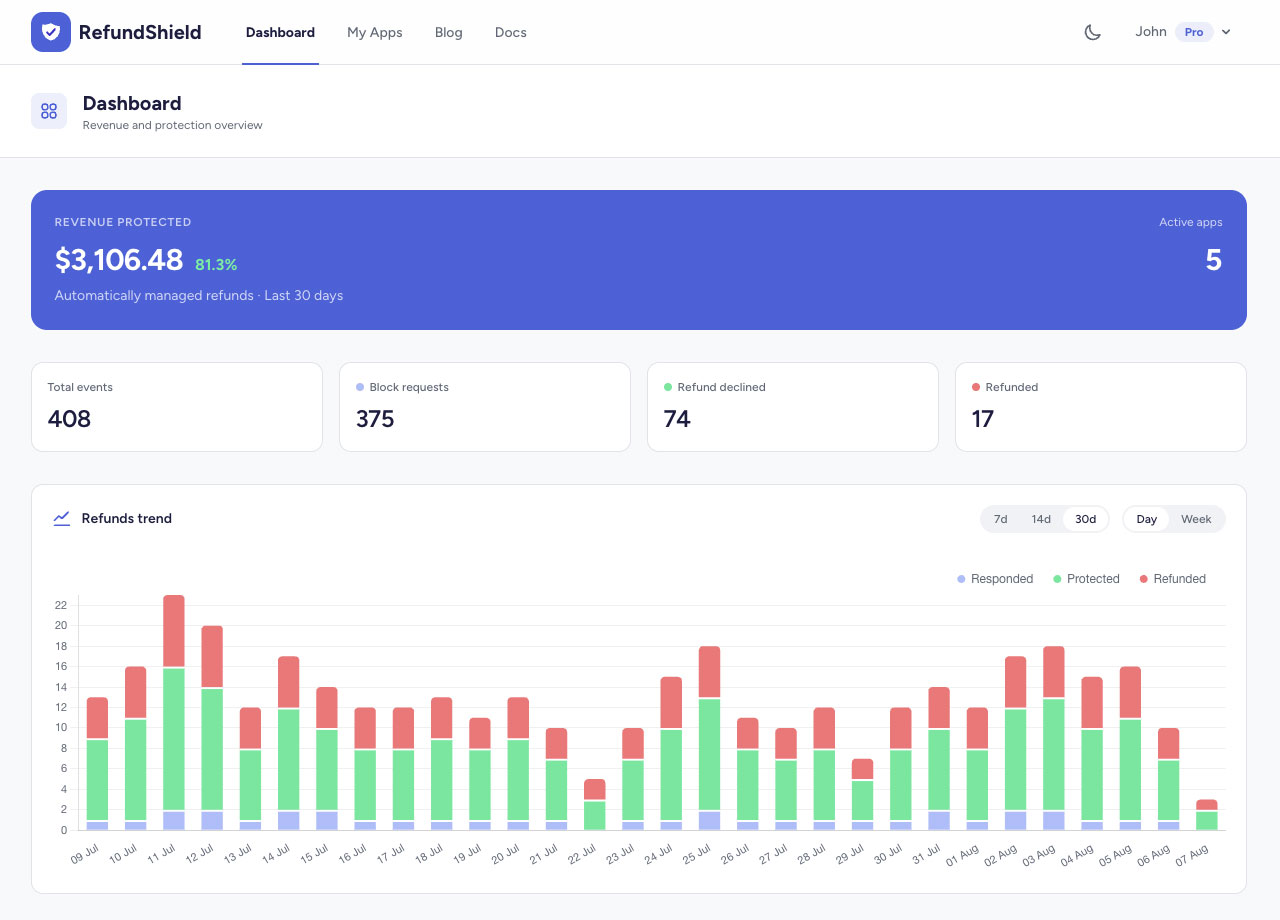
When you log in, the dashboard shows:
- Total events: all refund-related notifications received
- Declined: refund requests where RefundShield responded and the store (Apple or Google) sided with you
- Success rate: percentage of refund requests that the store denied after receiving your data
- Revenue protected: estimated USD value of refunds that were blocked
Charts
The interactive chart shows your refund activity over time. You can:
- Switch between 7 days, 30 days, and 90 days views
- See the trend of consumption requests, declined refunds, and approved refunds
- Hover over data points for exact numbers
Per-App Analytics
Each app also has its own analytics view. Go to Apps → select your app to see the same charts filtered to that specific app. This helps you compare performance across your portfolio.
Revenue Protected Calculation
The "Revenue Protected" metric is calculated by summing the purchase amounts (converted to USD) for all transactions where the store denied the refund (on Apple, a REFUND_DECLINED notification; on Google Play, an order that was not refunded). Currency conversion uses daily exchange rates that are updated automatically.